
Context and objective
A glass manufacturing plant needed hard data on how its internal transport fleet actually works: where the forklifts are, how long they stand idle, which routes they take and where congestion builds up. Inovatica AGV delivered a localisation system based on laser scanners mounted directly on the vehicles, with no warehouse rebuild, no floor works and no rack-mounted markers.
This is an anonymous case study. The customer’s name can be disclosed only after written approval, so the story focuses on the operating challenge, deployment scope and the value of measurable fleet data.
In a large, high-traffic facility, decisions about fleet size, shift staffing and route design were based mainly on supervisors’ observation and experience. The team lacked one reliable data source that could answer basic questions:
- how much fleet time was actual driving versus standing still,
- where congestion and stoppages appeared repeatedly,
- whether the number of vehicles matched the real demand of the process,
- whether inter-zone routes were still optimal after layout changes.
The production environment added another layer of constraints: variable in-hall layout, continuous traffic and no appetite for solutions requiring construction work, floor magnets or extensive marker infrastructure.
Solution and scope
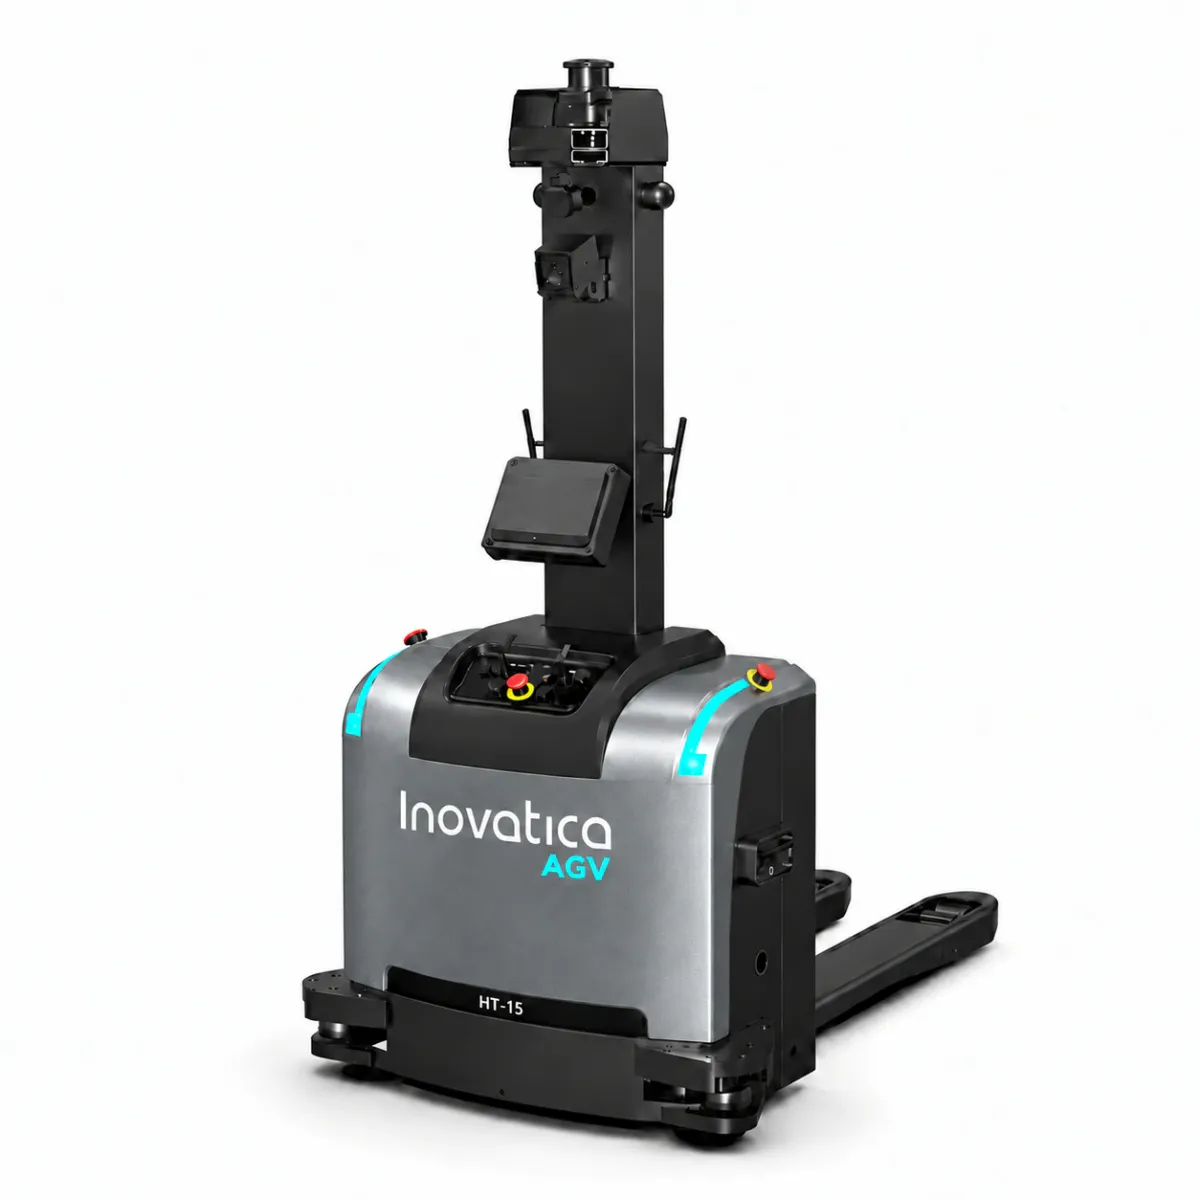
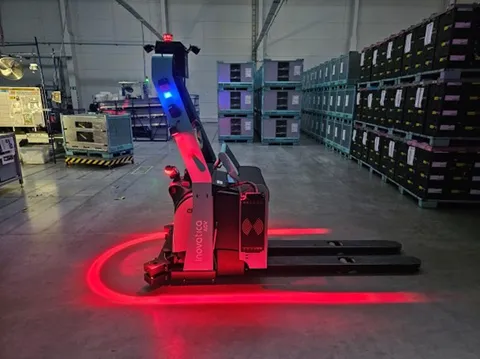
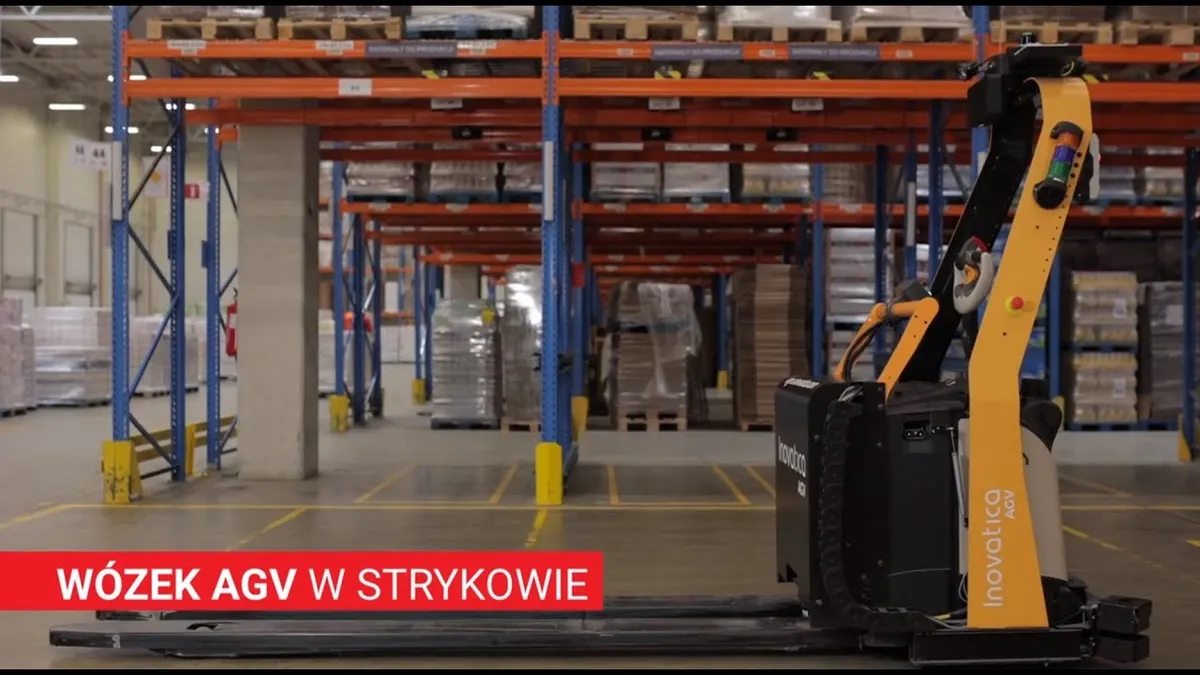
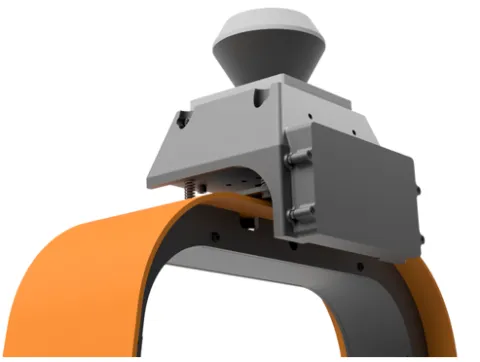
Inovatica AGV deployed a laser-navigation-based localisation and reporting system. Each monitored forklift received a measurement module mounted at the top of the mast. A LiDAR scanner produces a 2D scan of the surroundings, while a SLAM algorithm computes the vehicle’s position against a plant map created during the deployment.
The map is continuously verified by the scanner, which allows the system to operate in an environment where load placement and local layout change during a shift. The key characteristic is minimal facility infrastructure: navigation relies on the building’s natural geometry, while the need for any single reflectors is assessed during the pre-implementation analysis.
The on-vehicle module includes:
- a LiDAR laser scanner,
- an industrial computer that processes scans and sends data to the server,
- an industrial-grade Wi-Fi access point, IEEE 802.11 a/b/g/n,
- a backup power module and UPS, so operation continues during vehicle battery swaps,
- an industrial enclosure, power cabling and control buttons.
Real-time fleet visibility requires Wi-Fi coverage across the monitored operating area. If connectivity is lost, data about speed, movement direction and stoppage can still be collected locally, while the live application view returns after the connection is restored.
AGV Insight Reporting System
Vehicle data feeds a browser-based application running on the customer’s server. The system is designed to help the operations team move from observation to measurable conclusions quickly.
Live View
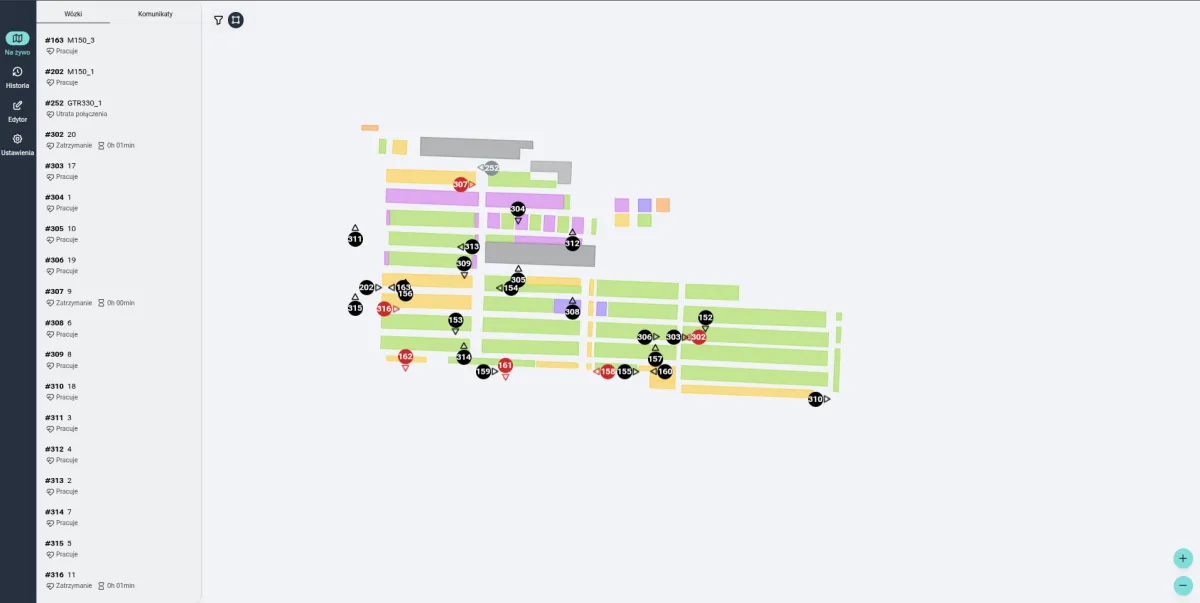
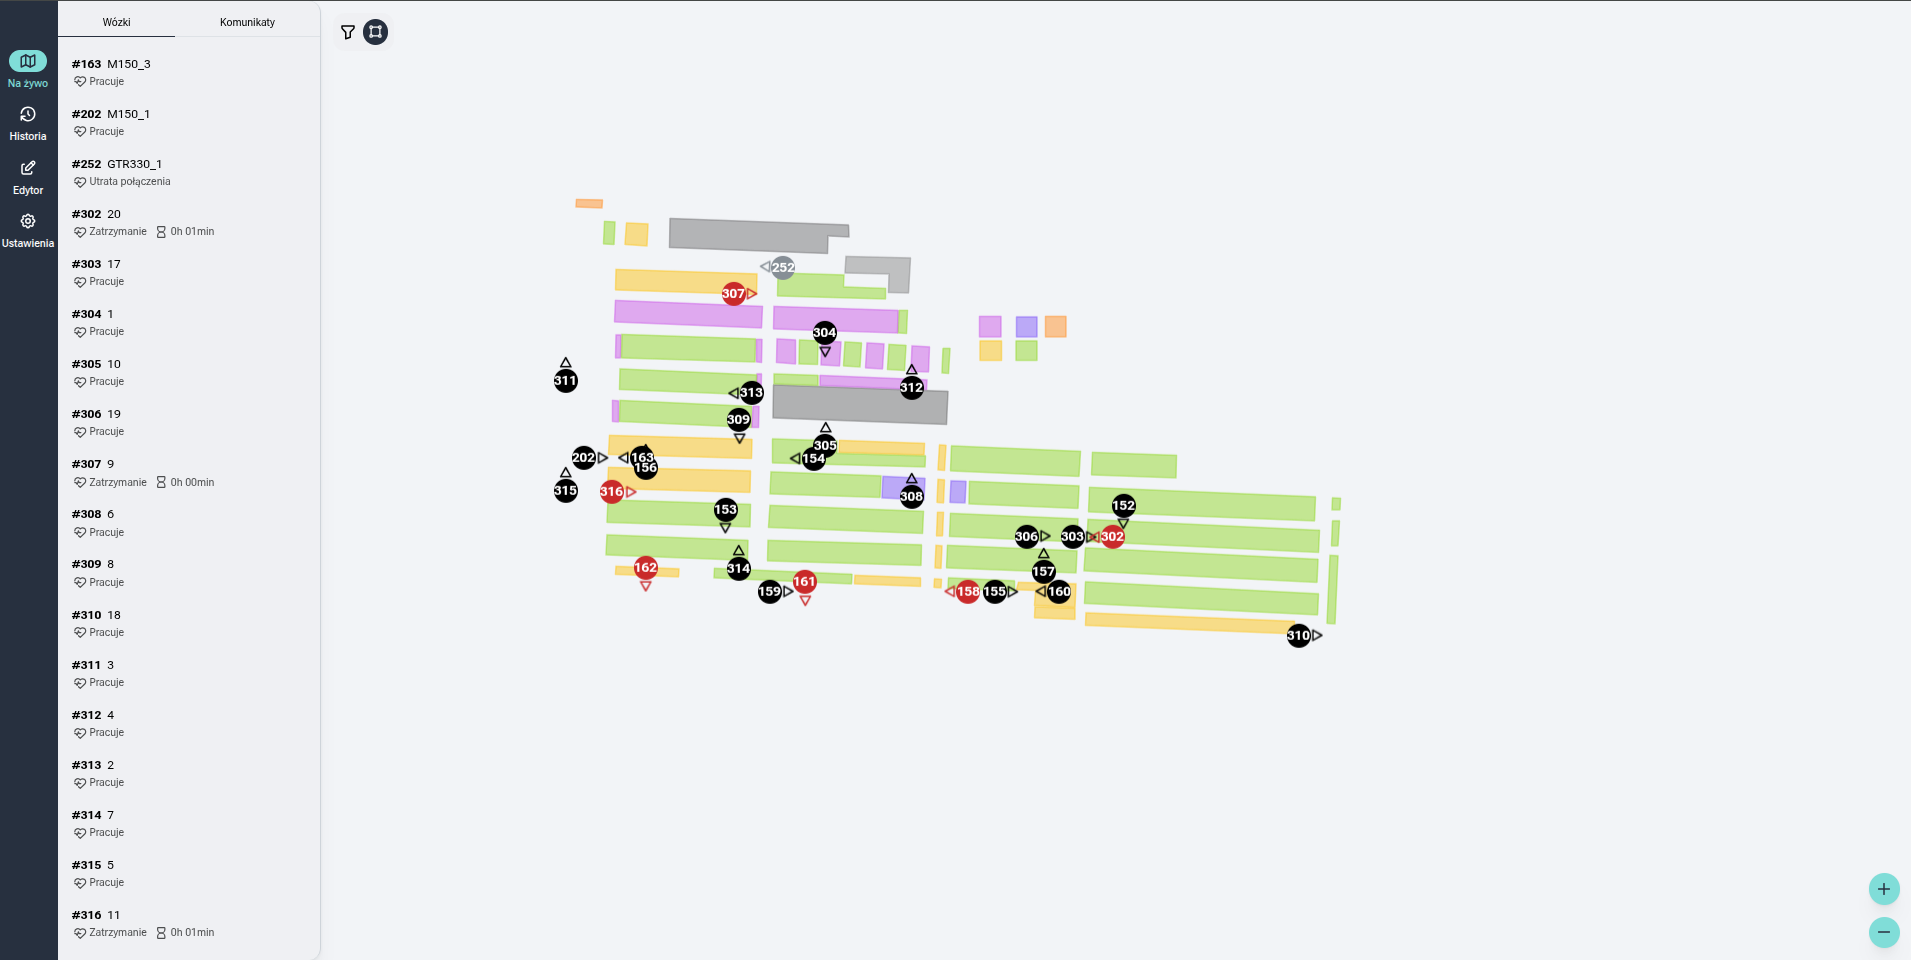
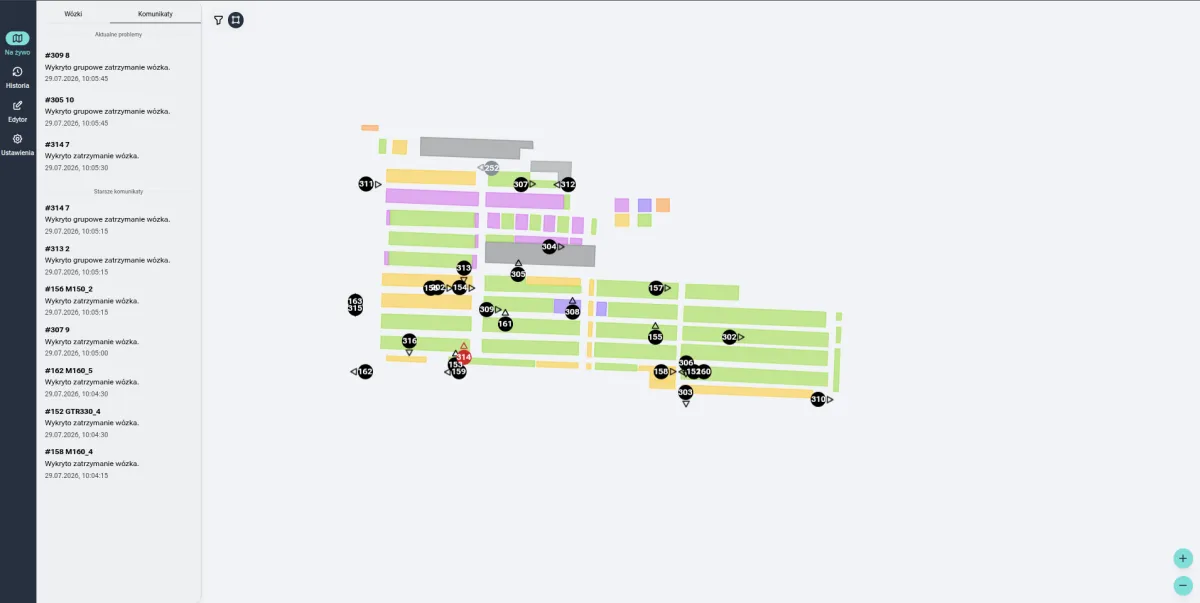
All vehicles are visible on the plant map in real time, with speed and current status: working, stopped or connection lost. A side panel shows each truck’s state and the duration of its current stop.
Events and Alarms
The system reports detected vehicle stoppages and group stoppages, where several trucks remain close to one another longer than a configured time. Events appear in the current-issues list and in the message history, making recurring risk points easier to identify.
History and Analytics
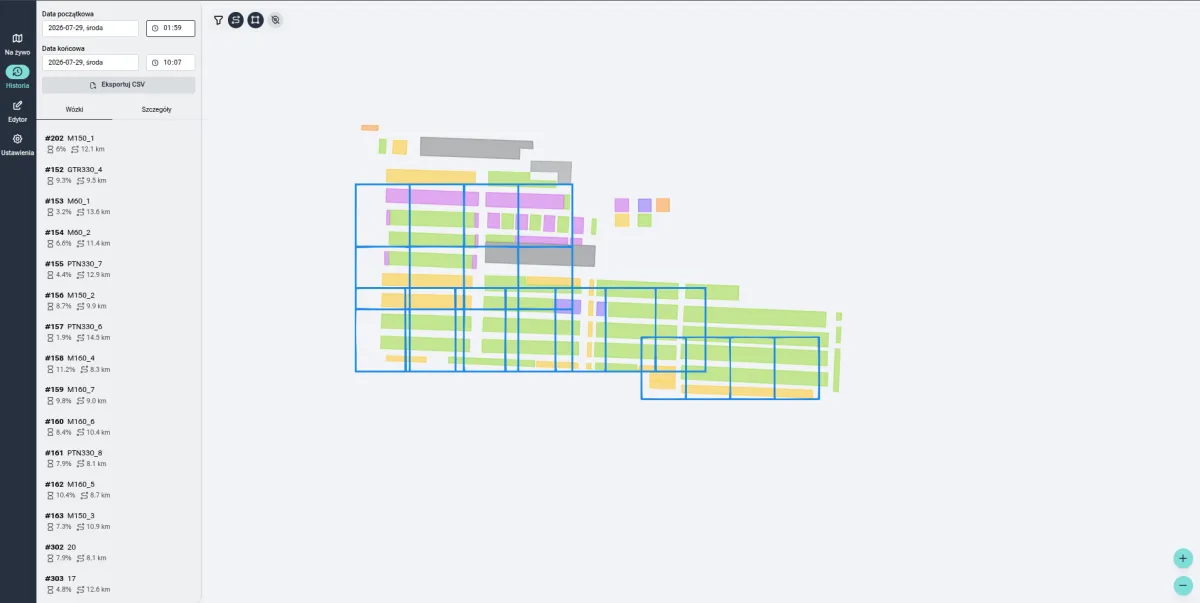
For any date and time range, the system displays movement trajectories on the plant map, idle time in absolute and percentage terms, distance travelled, travel times and speeds for defined routes, per-vehicle breakdowns and operator login history. Data can be exported to CSV for analysis in the customer’s own tools.
Zone Editor
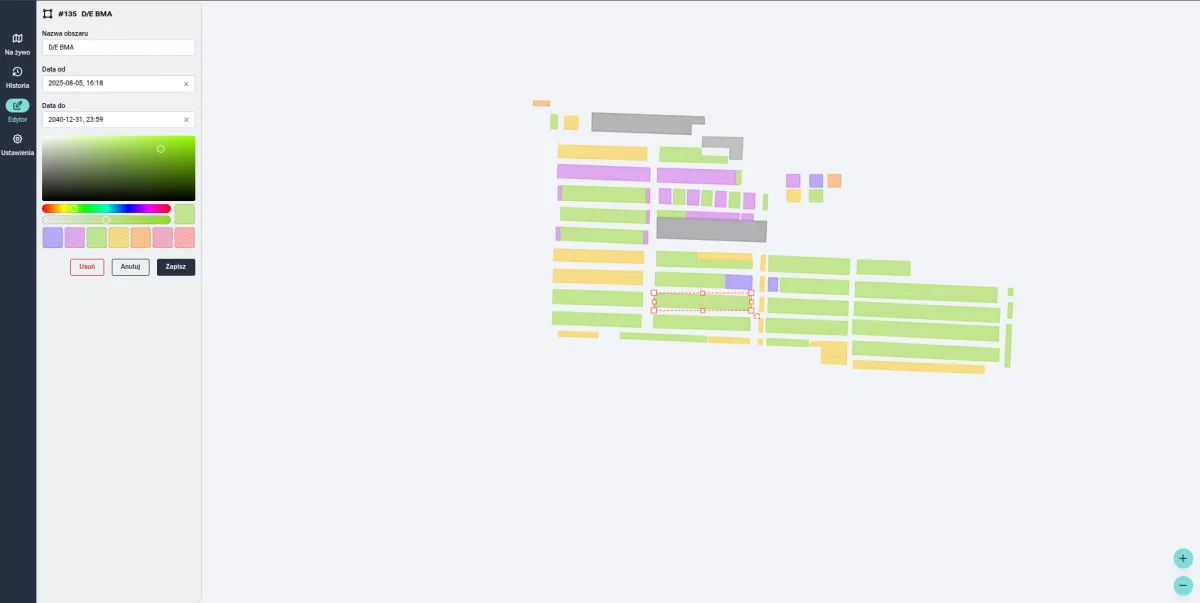
Users can draw rectangles and polygons directly on the plant map, assign names, colours and validity dates. This mirrors the real structure of the facility: production zones, warehouse buffers, lines, temporarily restricted areas and spaces that require separate analysis.
Thresholds and Operators
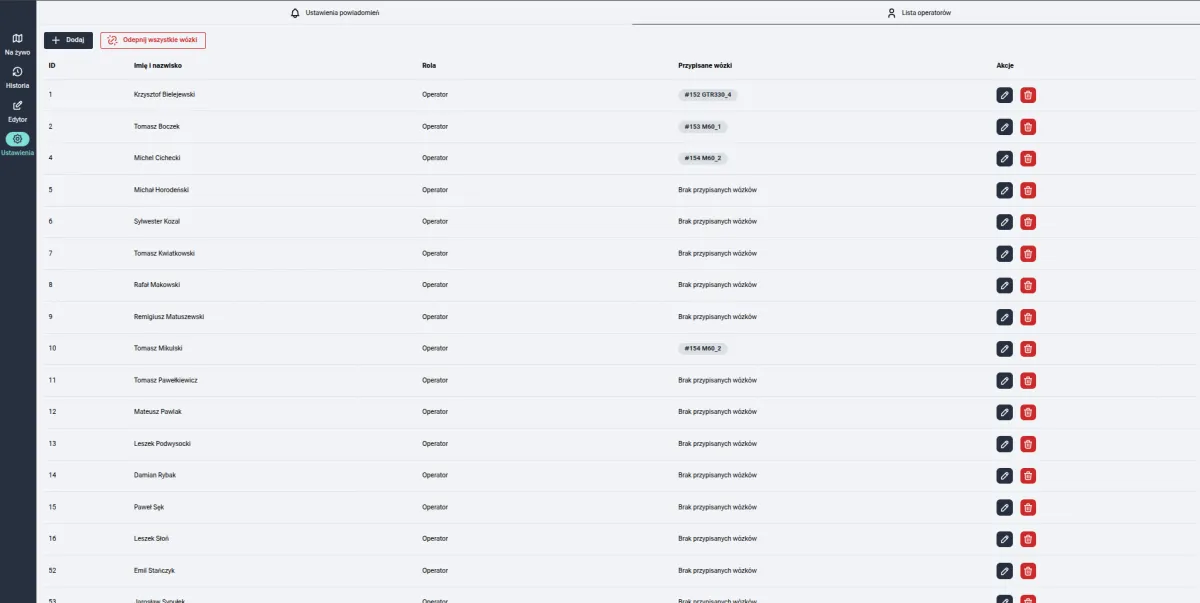
Detection parameters are set by the user: connection-loss timeout, idle time treated as a stoppage, position tolerance, and time and distance thresholds for group stoppage. The operator register with vehicle assignment links events to a specific shift and workstation.
Deployment
In the planned scope, the project included supply and installation of 14 measurement modules on the designated fleet vehicles, with main power supplied from the vehicle and backup operation during battery swaps. Inovatica AGV was also responsible for device configuration and calibration under live production conditions, plant mapping by laser scanning and graphic preparation of the map.
On the software side, the scope included installation and configuration of the reporting system on the customer’s Ubuntu server, user training and warranty support.
Outcomes
The plant gained a single source of truth about internal transport. Instead of estimates, the operations team has measurable data: where vehicles stand, for how long, in which zones, at which hours and under which staffing. Fleet size, route design, buffer layout and traffic safety can now be discussed on the basis of facts.
The deployment is also a natural first step towards automation. The same measurement that today optimises an operator-driven fleet can become a feasibility analysis for autonomous vehicles: it reveals real traffic intensity, transport cycles and critical points before the customer invests in AGVs.