
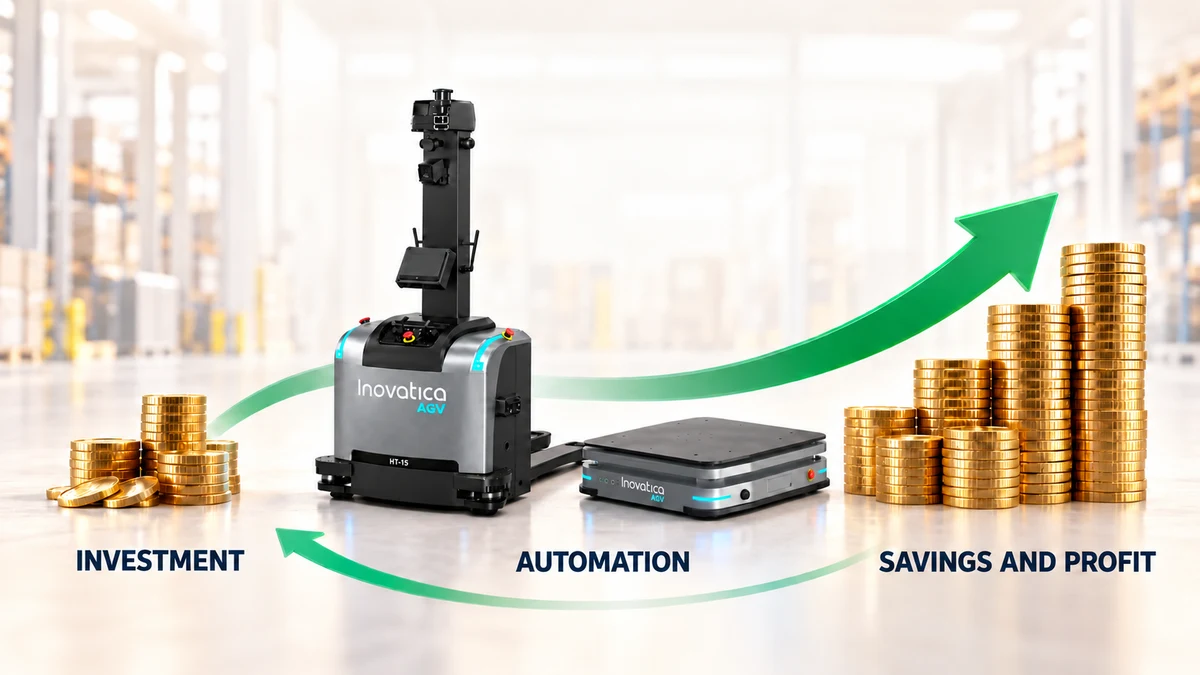
A realistic AGV ROI calculation should combine direct savings with process impact. Labor reduction, lower trip variability, fewer disruptions and better transport predictability all belong in the model if the project is meant to reflect operational reality.
The strongest business cases start from one specific scope: a high-frequency transport relation, a clear baseline and measurable KPIs. That approach makes it easier to evaluate both payback period and the next scaling step.
Start with the cost of the whole process. Vehicle price is only one part of the investment.
- Count integration and maintenance.
- Measure the current transport process.
- Compare savings with the full investment.
What to include in the initial calculation
Start with one transport flow: a defined load, pick-up point, destination and operating schedule. Record trips per shift, distances, handling times, waiting time and peak demand. Compare the manual and automated process at the same required service level.
Separate the costs into two groups:
- Initial investment: vehicles, load-handling equipment, charging infrastructure, fleet software, systems integration, site preparation, safety measures, commissioning and training.
- Recurring costs: software subscriptions, service, inspections, energy, consumables, replacement parts and the people needed to supervise or recover the process.
Use supplier quotations and site measurements for the detailed model. Check whether a software fee or service item is already included in another line before adding it again. For leased equipment, use a consistent cash-flow model rather than counting both the full purchase price and all lease payments.
Separate cash savings from capacity gains
Time released by automation is valuable, but it is not automatically a payroll saving. If employees move to other tasks and payroll remains unchanged, record the result as additional capacity. Cash savings may instead come from avoided overtime, temporary labour, future recruitment or a documented reduction in staffing costs.
Calculate the share of work the system can actually take over. One robot does not necessarily replace one operator: the operator may also inspect goods, prepare loads or handle exceptions. Check the proposed fleet’s capacity using the AGV throughput calculator and measured cycle times.
Other benefits can include fewer damaged loads, less waiting at production lines and more predictable deliveries. Monetise them only where there is a measured baseline and a credible link to the proposed change. Do not count the same recovered minutes as both labour savings and extra production margin.
The 2025 forklift operator cost breakdown explains the cost categories. Its historical salary and exchange-rate assumptions need replacing with your own current payroll data.
Calculate payback and define the ROI period
For a first estimate with steady annual savings, use:
Annual net savings = avoidable annual costs of the current process − annual operating costs added by the AGV system.
Simple payback in years = initial investment ÷ annual net savings.
This gives a recovery time, not a percentage return. If annual net savings are zero or negative, the investment does not pay back under those assumptions. Simple payback also leaves out the time value of money and benefits after the payback date; these limitations are explained in the US Department of Energy’s investment appraisal guide, pages 26–28.
For a stated evaluation period, a simple cumulative ROI can be defined as:
ROI = (cumulative net savings over the period − initial investment) ÷ initial investment × 100%.
State the period and accounting assumptions beside the result. A five-year cumulative ROI is different from an annual return. For the investment decision, ask the finance team to review the dated cash flows, discount rate, taxes, financing and any residual value.
A worked example with explicit assumptions
The following numbers are hypothetical. They illustrate the calculation and are not a price quotation, salary benchmark or promised project result.
- Initial investment: EUR 150,000.
- Avoidable labour and overtime costs: EUR 55,000 per year.
- Other measured, non-overlapping savings: EUR 10,000 per year.
- Added operating costs for the automated system: EUR 15,000 per year.
Annual net savings are therefore EUR 50,000: EUR 55,000 + EUR 10,000 − EUR 15,000. Simple payback is 3 years: EUR 150,000 ÷ EUR 50,000.
Over five full years at that steady saving, cumulative net savings are EUR 250,000. After subtracting the original investment, the net benefit is EUR 100,000 and the simple five-year ROI is approximately 66.7%.
This example excludes ramp-up, financing, taxes, discounting and residual value. If first-year savings were only EUR 25,000 during commissioning, followed by EUR 50,000 annually, payback would move to approximately 3.5 years, assuming savings accrue evenly within each year.
Test what happens when the assumptions change
Prepare a conservative case as well as the expected case. Change the variables that are uncertain at your site: transport demand, achievable cycle time, available operating hours, service costs and the proportion of labour costs that can actually be avoided.
In the example above, annual net savings of EUR 35,000 would extend simple payback to approximately 4.3 years. At EUR 65,000, it would fall to approximately 2.3 years. These are alternative assumptions, not a forecast range.
Frequent, repeatable work across several shifts can strengthen the business case. It still needs sufficient charging time, reliable handovers and capacity during peak hours. Adding robots without resolving a congested transfer point may increase the investment without producing the expected savings.
Verify the business case after commissioning
Agree the baseline, measurement period and owner of each metric before launch. Track completed transports, on-time delivery, manual interventions, operating availability and the actual cost of maintaining the system. Compare periods with similar demand and explain any changes in shifts or production volume.
Keep operational improvements and realised cash savings visible separately. That makes it possible to see whether the system is meeting the process target and whether the financial assumptions are holding.
Use the AGV ROI calculator for an initial estimate. A decision-ready assessment should also include the measured transport flow, implementation costs, a sensitivity analysis and an agreed plan for verifying the result.
This guide also incorporates the process and baseline assumptions from “How to calculate ROI for an AGV or AMR deployment”, published on 10 February 2026. The guide retains its original publication date and was updated on 21 October 2026.
A floor plan, load details and peak-hour transport demand are a useful starting point for a project discussion.